by Artie Leslie (As seen in MHD Supply Chain Solutions)
What is your current supply chain performance? How can you improve? In this article the author describes a process for supply chain performance assessment and improvement, and in the next issue we will consider a case study using this methodology.
The most challenging aspect of understanding your supply chain performance is creating visibility of that performance across the organisation. Furthermore, being able to create this visibility ongoing is fundamental to producing improvement.
If you don’t know what your performance is, then you don’t have a starting point for the improvement process. However, just knowing that performance is not enough, you need to know how others in the same industry sector or supply chain type are performing relative to your business. Once you can see both of these things, then you can focus the improvement effort to ensure the investment made gets the best or most appropriate return.
These two tasks and the communication of the results create the visibility for the business of supply chain performance and why we need to change. So how can we do this? Benchmarking Success (BMS) has been providing this information to companies for over 15 years. BMS is about supply chain development and improvement, utilising a supply chain diagnostic and audit tool, and an interactive information exchange through business improvement peer groups. Performance is compared to a supply chain best practice model to create a strategic supply chain overview that assesses current and best practice performance. The assessment examines service/s delivered by and through your supply chain to deliver that service. It also assesses management inputs deployed that drive performance, which are benchmarked with world class supply chain from our database.
Undertaking a supply chain health check
The understanding of performance commences with an audit which considers the end-to-end supply chain from supplier to customer delivery. This need to include:
- Company profile.
- Overview of supply chain management.
- Management of inventory.
- Manufacturing contribution to supply chain (where appropriate).
- Distribution centre/warehouse management.
- Transportation – inbound and outbound.
- Customer service.
- Supply chain costs.
This data is captured using an online diagnostic that provides the user(s) with the capability to populate the diagnostic themselves. This does not create spurious data as there are validation steps and clear definitions provided to the business.
This task will create an understanding of the service delivered by the supply chain and the cost incurred to deliver that service, as well as providing a view of the supply chain inputs (or management enablers) that drive these service and cost inputs.
Results are benchmarked against a comparative dataset of companies from the BMS database to crease an understanding of how the performance of a business compares to that of businesses operating similar supply chains.
This process not only provides an answer to the ‘what’ but also the ‘how’ of supply chain improvement through a detailed understanding the processes that best-in-class companies use.
The ‘Health Check’ examines:
- Health check of supply chain: overall wellbeing of the organisation. Organisation can strategically answer: “Is this where we want to be?”
- Where to look in supply chain to confirm health: functions & processes in supply chain; the organisation.
- What to focus on to improve your health: organisation can identify what to focus on.
- How to improve your health: fix current issues (specialisation takes over). Aggregate/process level by BMS, e.g. CS Pol./Inv Pol./Pareto of inventory, followed by transactional analysis.
Step 1: A health check of your supply chain
This step follows the methodology above. The relevant outputs from the strategic supply chain audit (SCAR) report are shown in Figure 1.
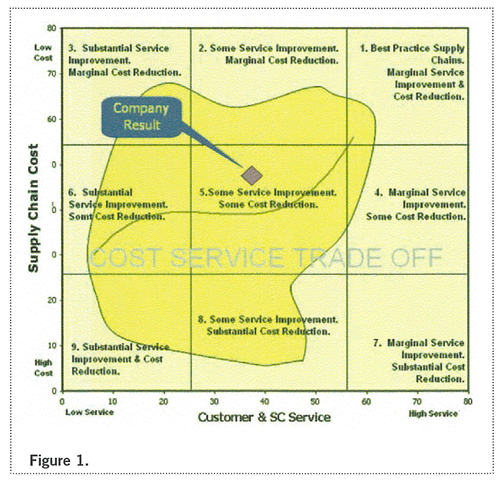
The cloud in Figure 1. compares overall cost performance on the vertical axis (careful, the scale is from high to low, so it is counter-intuitive, but right for the graph), and service on the horizontal. The yellow cloud contains the comparative results for all similar supply chains from the database. It provides a high-level view of supply chain comparative performance. The line through the centre of the cloud provides the line of best fit for the data. As a result it provides the likely outcome of any company moving from bottom to top or left to right against the dataset.
The Inputs/Outputs cloud (Figure 2.) assesses the extent to which the management inputs related to plans, KPIs, enabling systems, structure, evaluation tools and supply chain relationships affect the outputs of service and cost.
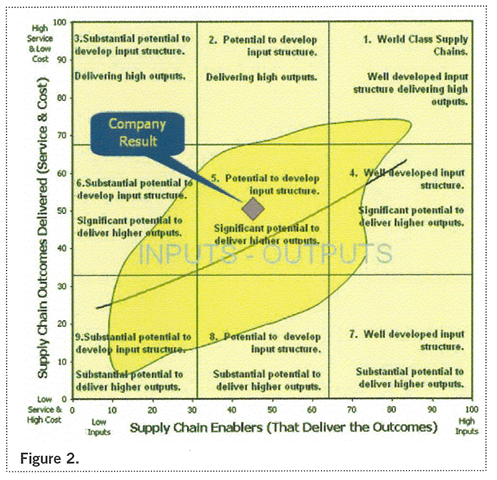
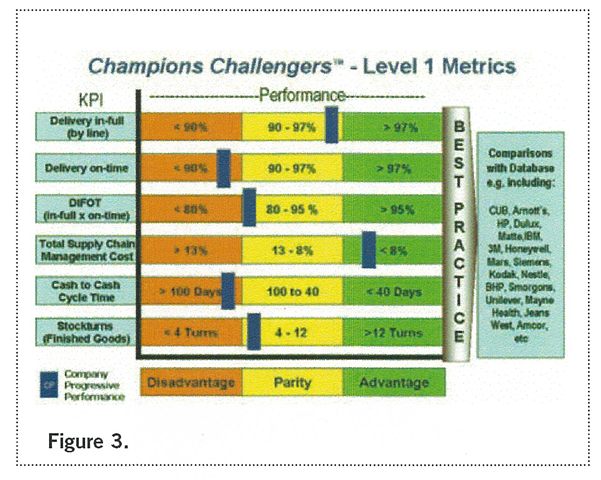
Figure 3. Level 1 metrics provide an assessment of the supply chain health across key performance metrics as shown. Part of the comparison is to establish whether the performance of the business is at a disadvantage, on a par or at an advantage when compared to the actual performance of the comparative group. This comparison will change for each business and comparative dataset.
At this point you have a high-level view of your supply chain performance. Once this step is completed for each of these views, the business needs to consider its answer to the question: “Strategically, is this where I want to be?”
Step 2: Where to look to confirm the health of the supply chain?
At this level, we are looking for the elements of the supply chain and their comparative performance against a known dataset. This starts with an output that identifies the performance by functional area. Best practice for service (highest) and cost (lowest) are the extreme outside of the radar.
This view enables us to identify the trade offs between cost and service and where they occur, and indicates where the improvement effort is going to have the most effect.
Figure 4. Where the manufacturing element is also assessed, a sixth spoke is added to the radar.
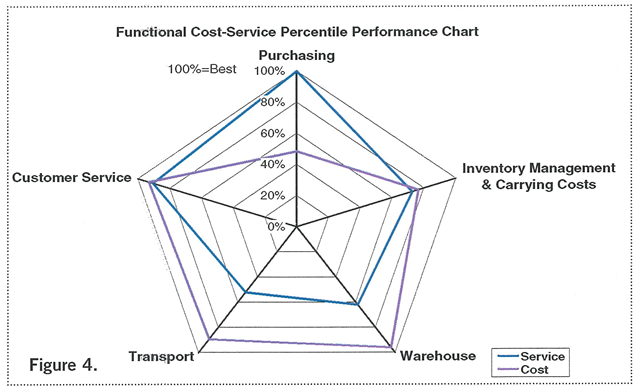
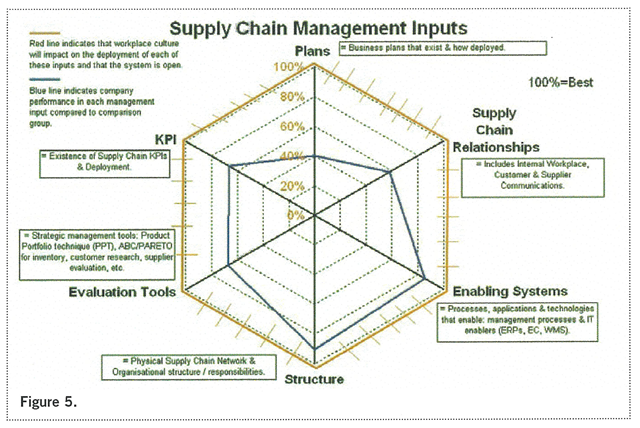
Similarly, the performance of the inputs can be assessed and again compared with the same comparative dataset. This provides a view of how management inputs (the blue line on the graph) compare to best practice (around the outside).
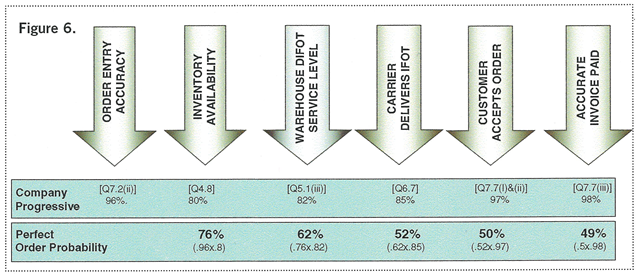
Along with another consideration of the Level 1 Metrics (Figure 5.) made at this step, we also need to consider the effect of the perfect order on overall performance of the outbound supply chain.
The best way to look at this is to assume the customer sits to the right hand side of this graphic. So the customer sees the net effect of these six processes – in this case, that more than half of the orders placed with the business have a issue with them.
The focus for improvement is centred on the functional areas and performance silos that confirm the supply chain health of the business. So, what are we going to do?
Step 3: What to focus on to improve your health?
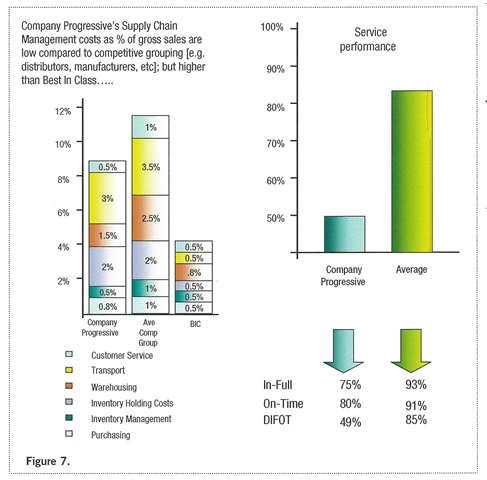
At this level we are looking at several of the outputs we have already considered. However, we are now looking for where the opportunities for improvement exist and the extent of improvement possible. Apart from Level 1 KPIs, Perfect Order, and Radars, we need to also look at the cost and service histograms. These will identify current performance and how that matches best-in-class for the comparative dataset.
The extent to which the business can improve, or approach best-in-class performance, can then be assessed. The processes that may need to be adopted to do that are identified from those used by the best-in-class performers. While the processes are identified the companies are not, however, the extent to which the business can approach best-in-class can be identified.
Step 4: How to improve your health?
Once all this information has been considered the business can assess what it will do. As above, this is about understanding the sort of processes that are used by best-in-class businesses in the comparative dataset.
Either the business can decide which things need to be fixed, or BMS can assist with this process and the implementation of the improvement initiative that have been identified through this process.
Using this approach, in less than 12 months BMS has seen businesses move to number one supplier status, while significantly increasing sales and reducing lead time and overall logistics and supply chain costs by as much as 2% (logistics cost as % of sales).