Supply Chain Benchmarking – To Gain Cost Saving Efficiency
Best in Class Supply Chains operate at half the cost
Benchmarking can make your Supply Chain more efficient,
talk to a Benchmarking Consultant today.
Where You’ve Seen Us
Benchmarking Lessons from Sports
Running a mile in less than four minutes was considered impossible.
Then Roger Bannister did it in April 1954.
And in the next 18 months his record was broken 12 times!
A new benchmark had been set and expectations and performance increased accordingly.


Usain Bolt is the world’s fastest man.
He is the benchmark.
If you want to beat his time, first, you have to know what it is. It’s 9.58 seconds.
If you want your supply chain being the best, first, you need to know what the benchmark for your industry is.
Johnny Weismuller WAS the world’s fastest man.
An olympian and a movie star, Johnny Weismuller setthe benchmark in the pool.
He held 69 world records and at one time held EVERY world record from 50 yards to 1 mile.
But nowadays his world record times are bested by 13 year olds because the benchmark is a moving goalpost!
That’s why it’s essential to re-benchmark against the marketplace to understand what the new best is on a regular basis.

The Difference in Costs is Huge!

To find out how Benchmarking can make your Supply Chain more efficient, talk to a Benchmarking Consultant today.
Benchmarking – The Most Popular Management Tool*
The 2009 report demonstrated that the most popular management tool was benchmarking.
The survey, conducted in January 2009 encompassed 1,430 international executives from companies from a broad range of industries and focuses on 25 tools that are available to executives.
Benchmarking overtook strategic planning to top the tool usage list because benchmarking was seen as a priority in achieving cost savings in the business while improving service simultaneously.
One executive observed that for benchmarking to be most effective, his company has to dig deeper.
“I’d like to see more granular, actionable benchmarking in the future. That way if we’re not doing well compared to our competitors, it’s a red flag to address a problem.”
* Source: Bain & Company, Management Tools & Trends 2009
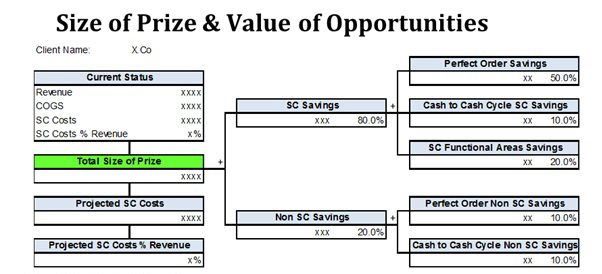
Size of the Prize
Cost savings become possible when performance is improved by 1 or 2 decile ranks in key supply chain cost driving areas, such as:
- Perfect order
- Cash to cash cycle
- Supply chain functional cost silos.
The calculation logic of the Size of Prize is based on the following:
- Using key areas of supply chain cost silos, perfect order and cash to cash cycle.
- Positioning of the company under review as “decile” placing for each of these key areas (i.e. decile 10 = top 10%, decile 1 = bottom 10%)
- Calculate the savings if company improves by 1 decile ranking for each of the key areas.
- Also calculate savings for improving 2 deciles.
- Calculating both the direct SC and indirect SC savings.
- A sample is set out below using the Plumbing Chart approach
How is Performance Measured?
You can’t Improve What You Do Not Measure!
BMS’s approach to improving service through benchmark measurement of both service and cost performance is to apply a series of in depth KPIs.
In essence, benchmarking involves carrying out a super-audit of a company’s end-to-end supply chain from supplier to customer delivery.
Categories should include at least some of the following:
- Procurement
- Overview of supply chain management
- Management of inventory
- Manufacturing contribution to supply chain
- Distribution centre/warehouse management.
- Transportation – inbound and outbound.
- Customer service
- Supply chain costs
Identifying KPIs
Essential KPIs to be measured include some or all of the following, depending on the industry:
- Delivery in full. This measures the percentage of orders that were delivered in full over a given time period.
- Delivery on time. This KPI measures inbound deliveries or those you make to your customers to determine the percentage of sales or purchase orders that are made on time.
- Delivery in full and on time (DIFOT). This KPI is calculated by dividing the number of orders delivered in full and on time by the total number of orders delivered in a given time period.
- Supply chain cost as a percentage of sales. If, for example, your company concludes sales worth $2 million with supply chain costs totalling $200,000, supply chain management cost as a percentage of sales would be 10%.
- Cash-to-cash cycle time. This KPI measures the average elapsed time from when your company pays for raw materials or finished goods to when the end customer makes payment.
- Stock turns. This KPI calculates the rate at which your inventory is consumed. It is measured by dividing the cash value of inventory consumed in a year by the cash value of inventory usually held in your warehouses.
Get a Clear Picture
The results are then compared, or benchmarked, against the data of businesses operating similar supply chains, allowing a company to identify areas where efficiencies can be effected and where costs can be cut.
Because data from rival companies are hard to come by, Benchmarking Success is here to help you. BMS keeps a database of KPIs from more than 800 supply chains across a range of industries. Feel free to check out the services on offer.
Maximizing Supply Chain Performance Through Benchmarking
Supply chain benchmarking is a critical practice that enables organizations to assess their operations against best-in-class performers or industry standards. This process reveals performance gaps, helps set actionable goals, and drives continuous improvement in key areas like cost, service levels, and operational efficiency. When applied correctly, benchmarking can transform a business’s approach to supply chain management, leading to enhanced performance and long-term competitiveness.
Understanding Supply Chain Benchmarking
Benchmarking involves comparing your supply chain’s key performance indicators (KPIs) against either internal divisions, competitors, or industry averages. It’s a vital tool for gaining clarity on where you stand in terms of performance, identifying areas of improvement, and understanding the strategies that are working for leading companies.
A typical benchmarking process includes the following steps:
- Defining Scope and Objectives: The first step is to clearly outline what aspects of the supply chain will be benchmarked. This could involve logistics, warehousing, inventory management, transportation, or even procurement processes. Setting specific goals ensures the benchmarking efforts remain focused and relevant.
- Identifying KPIs: Selecting appropriate KPIs is essential for effective benchmarking. These could include metrics like order-to-delivery time, inventory turnover, cost per shipment, or customer service levels. It’s critical that these KPIs align with the overall business objectives and reflect areas where improvements can lead to significant gains.
- Collecting Data: Data collection involves gathering relevant internal performance data and comparing it with external benchmarks. This can be done through surveys, industry reports, or purchasing performance data from benchmarking services.
- Analyzing Results: Once data is collected, it needs to be analyzed to identify performance gaps. This step highlights areas where the supply chain is underperforming compared to industry leaders and identifies opportunities for improvement.
- Implementing Change: After identifying areas for improvement, the next step is to implement strategies to close the gaps. This might involve process optimization, adopting new technologies, or restructuring supplier contracts to reduce costs or improve service levels.
- Monitoring and Continuous Improvement: Benchmarking is not a one-time activity. Regular monitoring of performance and periodic benchmarking help ensure that improvements are sustained and new opportunities for optimization are continually identified.
Key Benefits of Supply Chain Benchmarking
There are numerous advantages to supply chain benchmarking, making it a highly valuable tool for any organization aiming to stay competitive.
1. Enhanced Cost Efficiency
One of the most immediate and significant benefits of benchmarking is the identification of cost-saving opportunities. By comparing your operational costs with those of industry leaders, you can uncover areas where you’re overspending. This could include inefficiencies in transportation routes, excessive warehousing costs, or inventory that ties up capital unnecessarily. Benchmarking provides a roadmap for streamlining operations and reducing costs without sacrificing service quality.
For example, if a company discovers through benchmarking that their transportation costs per unit are higher than the industry average, they can investigate whether optimizing route planning or renegotiating carrier contracts could bring costs down.
2. Improved Service Levels
Benchmarking also helps organizations improve their customer service metrics. By comparing KPIs such as order accuracy, on-time delivery rates, and customer satisfaction scores with top performers, businesses can identify where they need to make improvements to meet or exceed customer expectations.
Improving service levels can lead to increased customer loyalty and market share, as satisfied customers are more likely to return and recommend your services to others. In highly competitive markets, even slight improvements in service performance can make a significant difference.
3. Increased Agility and Responsiveness
In today’s fast-paced business environment, supply chains need to be agile and responsive to changing market conditions. Benchmarking can help businesses identify areas where they can increase their agility, such as reducing lead times, improving supplier responsiveness, or optimizing inventory levels.
For instance, if a benchmarking analysis reveals that a competitor has significantly shorter lead times, it may be worth investigating whether adopting more advanced forecasting tools or collaborating more closely with suppliers could reduce delays in your own supply chain.
4. Fostering Innovation and Best Practices
Benchmarking doesn’t just reveal performance gaps—it also provides valuable insights into what industry leaders are doing right. By studying the best practices of top-performing companies, businesses can adopt new technologies, processes, or strategies that will help them innovate and improve their own supply chain operations.
For example, a company might discover through benchmarking that industry leaders are using advanced warehouse automation systems to improve efficiency and reduce labor costs. This could prompt the business to explore similar technologies to stay competitive.
5. Supporting Strategic Decision-Making
Another significant benefit of benchmarking is that it provides data-driven insights to support strategic decision-making. When you have a clear understanding of where your supply chain stands compared to others, it becomes easier to make informed decisions about where to invest resources, which areas need improvement, and which strategies are likely to yield the best results.
For example, if benchmarking reveals that competitors are achieving better results by outsourcing certain aspects of their logistics operations, this data can support a decision to explore outsourcing options as part of a broader supply chain strategy.
6. Encouraging a Culture of Continuous Improvement
Benchmarking isn’t a one-time exercise; it’s a continuous process that helps foster a culture of ongoing improvement. By regularly benchmarking performance, businesses can stay aligned with industry trends, adapt to new market conditions, and continually enhance their operations.
Regular benchmarking ensures that companies don’t become complacent and helps them maintain a competitive edge. In an industry where rapid changes in technology, customer expectations, and market conditions are common, this continuous improvement mindset is essential for long-term success.
Supply Chain Benchmarking as a Competitive Advantage
In a world where supply chain performance can make or break a business, benchmarking provides a significant competitive advantage. It allows organizations to take a step back, assess their current performance, and make informed decisions that drive both short-term improvements and long-term success.
By regularly benchmarking your supply chain performance, you not only gain insights into how you can improve cost efficiency, service levels, and agility, but also ensure that your operations remain aligned with industry best practices. The end result is a supply chain that’s not just competitive, but positioned for ongoing success in an ever-evolving market.
Incorporating supply chain benchmarking into your regular business processes is an investment in future growth and efficiency. It gives you the tools and insights needed to optimize operations and deliver superior results to customers, all while keeping costs under control and fostering innovation within your organization.