
Have you ever watched a motor mechanic determine the precise location of that pesky water leak in your engine’s cooling system?
He or she will blast compressed air into the top of the radiator while watching for water to spurt out, either from a hose, through a gasket, or from the radiator itself. A set of gauges will determine the rate of leakage.
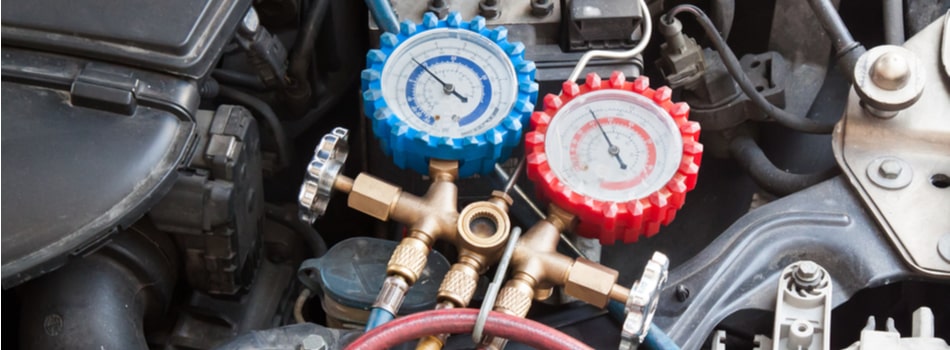
In a sense, that is what the pandemic has been doing to your supply chain—putting every sector under extreme pressure and exposing the leaks.
How the Pandemic has put Supply Chains to the Test
In normal times, various policies and processes instituted across the supply chain usually cause profit leakages of around 17 percent.
The disruptions brought by the pandemic have made the leaks a whole lot worse—so they should be easier to see and fix!
Here are some examples of the extra pressures piled on by the virus:
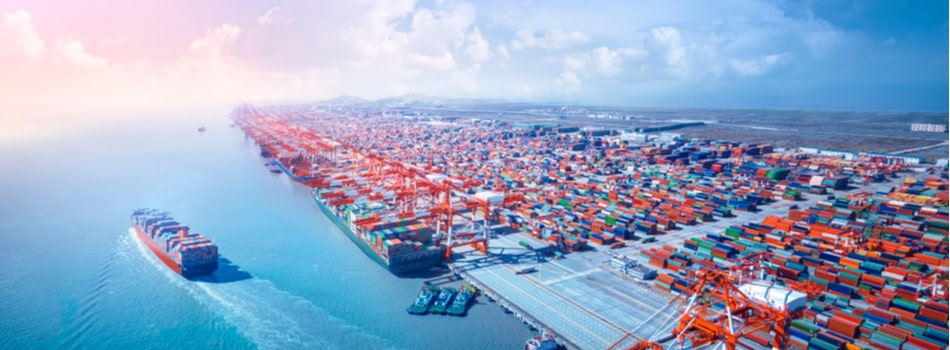
- Inability to source product due to global lockdowns, shipping backlogs, and transport bans
- Difficulty in keeping track of supplies and suppliers
- Manufacturing drastically reduced due to the closure of factories
- Risks of virus contamination in warehouses

- Road transport hammered by lack of drivers
- Spikes in demand for some products, leading to empty supermarket shelves
- Loss of demand for other products, causing warehouse overstock
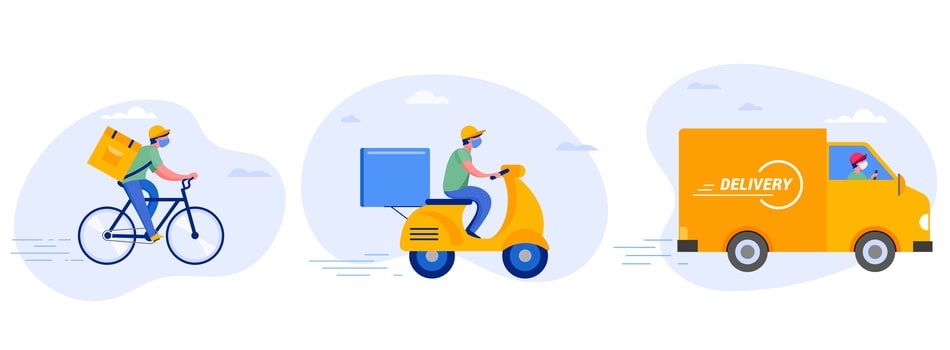
- Extra demand on home delivery services, resulting in lengthy delays.
How to Find the Leaks
If you want to staunch the haemorrhaging, it is essential to measure and analyse all relevant KPIs, such as the following:
1). At Source: MOOs, unit costs, contract terms, supplier management.
2). Inbound Transport: Transport mode, transport rate, transport frequency, load time.

3). Primary Warehousing: Location, unit loads, degree of automation, stock turns.
4). Outbound Transport: Transport Mode, transport rate, transport frequency, asset utilisation
5). Satellite or Customer Warehousing: Location, unit loads, degree of automation, stock turns.
6). Delivery Transport: Transport Mode, transport rate, transport frequency, asset utilisation.
7). Customer or Consumer: MOOs, order frequency, prices/discounting, service order.

I would advise that you do this important benchmarking right now, while the pandemic is still pressurising supply chains. It may be more difficult to determine performance weaknesses once the pressure is off again.
If you have specific queries about benchmarking, KPIs, and related issues, please do not hesitate to get in touch with us here at Benchmarking Success. We’ll be delighted to help.